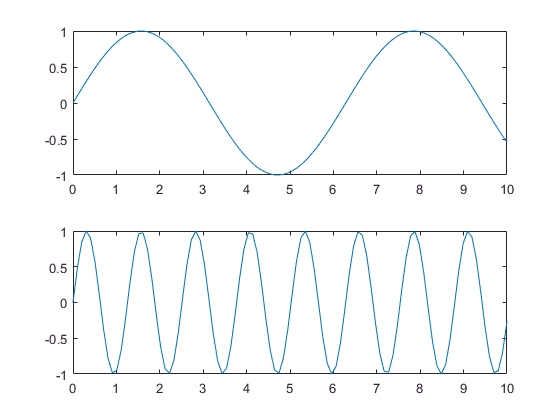
از تابع subplot(m,n,p) استفاده کنید که به ترتیب m تعداد سطر n تعداد ستون و p هم موقعیت تصویر با شروع از یک
مثلا به صورت زیر:
subplot(2,1,1);
x = linspace(0,10);
y1 = sin(x);
plot(x,y1)

subplot(2,1,2);
y2 = sin(5*x);
plot(x,y2)
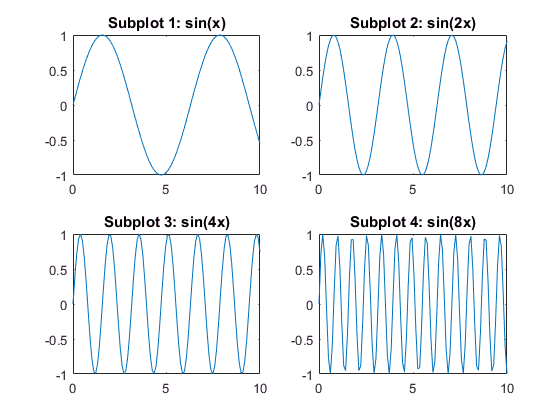
subplot(2,2,1)
x = linspace(0,10);
y1 = sin(x);
plot(x,y1)
title('Subplot 1: sin(x)')

subplot(2,2,2)
y2 = sin(2*x);
plot(x,y2)
title('Subplot 2: sin(2x)')

subplot(2,2,3)
y3 = sin(4*x);
plot(x,y3)
title('Subplot 3: sin(4x)')

subplot(2,2,4)
y4 = sin(8*x);
plot(x,y4)
title('Subplot 4: sin(8x)')
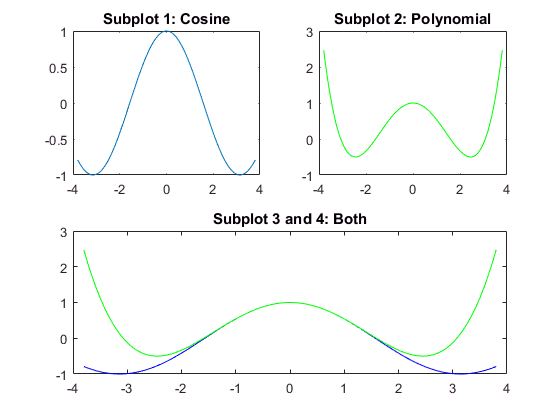
subplot(2,2,1);
x = linspace(-3.8,3.8);
y_cos = cos(x);
plot(x,y_cos);
title('Subplot 1: Cosine')

subplot(2,2,2);
y_poly = 1 - x.^2./2 + x.^4./24;
plot(x,y_poly,'g');
title('Subplot 2: Polynomial')

subplot(2,2,[3,4]);
plot(x,y_cos,'b',x,y_poly,'g');
title('Subplot 3 and 4: Both')